The Dashboard gives you an instant overview of your support operations. See key metrics, team performance, and trends at a glance.
Overview Cards
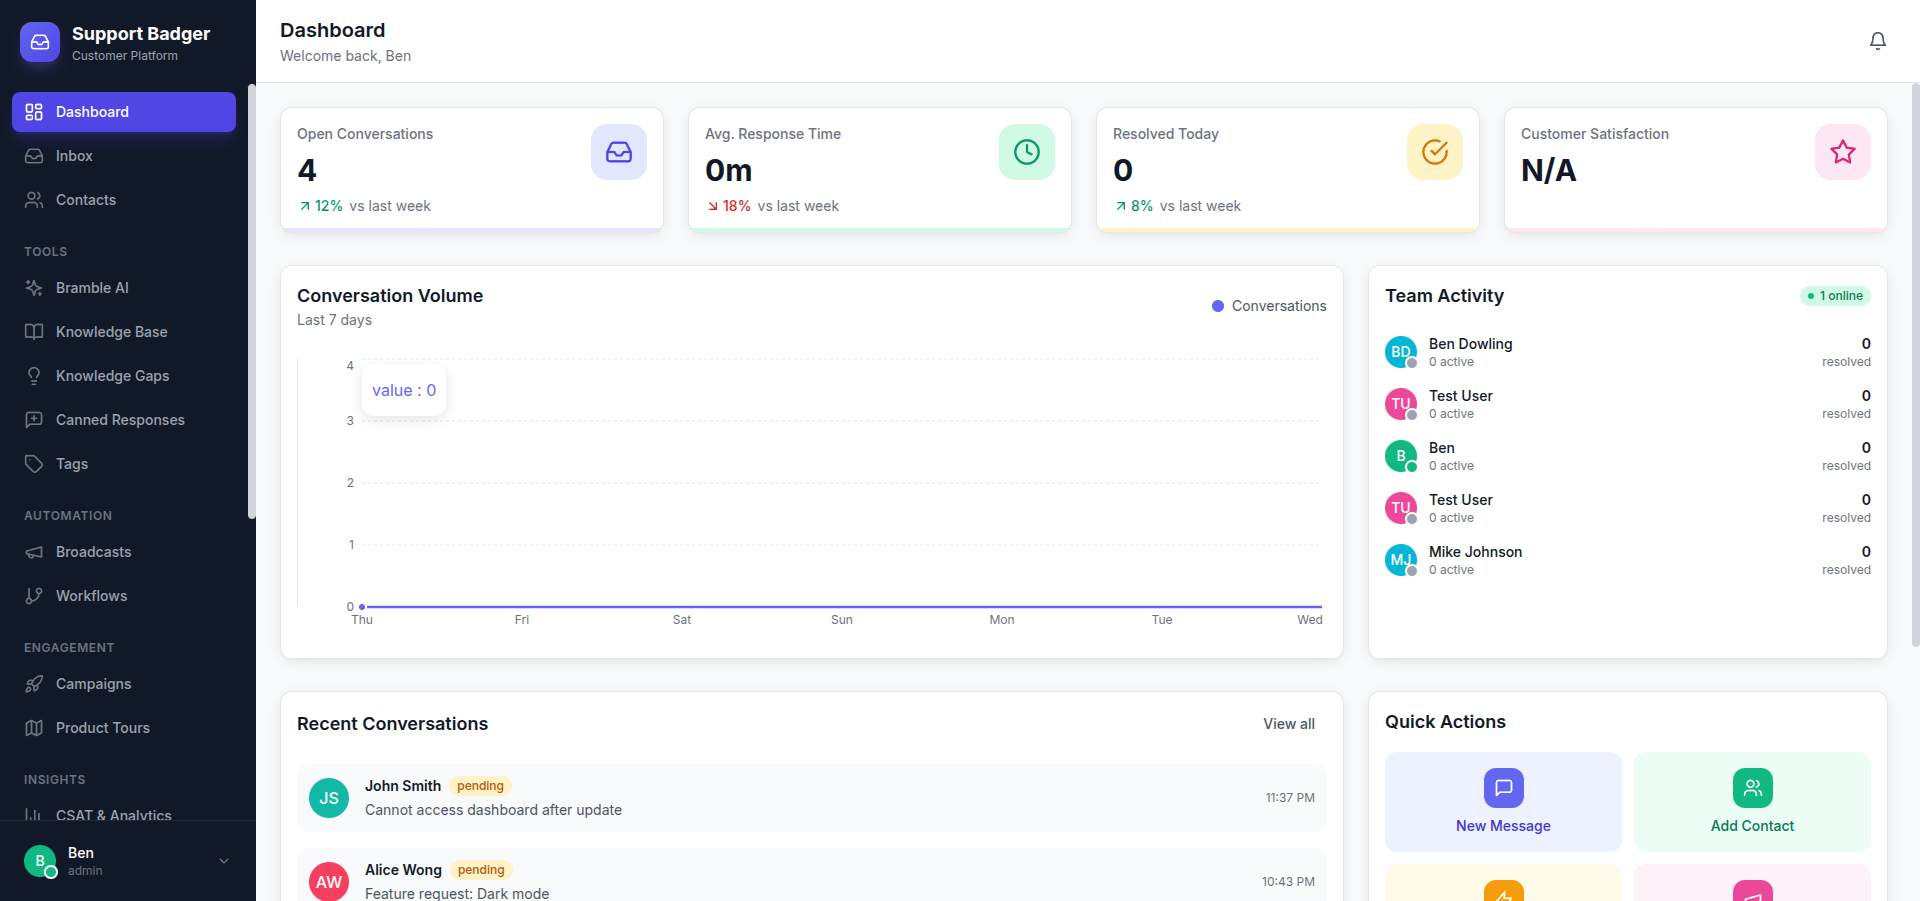
The top of the dashboard shows key metrics:
| Metric | Description |
|---|---|
| Open Conversations | Currently active conversations needing attention |
| First Response Time | Average time to first agent reply |
| Resolution Time | Average time to resolve conversations |
| CSAT Score | Customer satisfaction rating |
Conversation Queue
See conversations requiring attention:
- Unassigned - Conversations waiting for an agent
- Awaiting Reply - Your conversations needing responses
- SLA At Risk - Approaching or breached SLA targets
- Oldest Open - Longest-waiting conversations
Charts & Graphs
Volume Trend
Line chart showing conversation volume over time:
- Created vs. resolved comparison
- Toggle between day, week, month views
- Identify busy periods and trends
Response Time Distribution
See how response times break down:
- Under 1 hour, 1-4 hours, 4-24 hours, 24+ hours
- Compare to your SLA targets
Channel Breakdown
Pie chart showing conversations by channel:
- Email, Chat, Slack
- Identify your busiest channels
Team Activity
Monitor your team's current status:
| Status | Meaning |
|---|---|
| Online | Available and active |
| Away | Temporarily unavailable |
| Busy | Working but not taking new conversations |
| Offline | Not currently working |
Agent Metrics
Quick view of each team member's status:
- Open conversations assigned
- Conversations handled today
- Average response time today
Recent Activity
Timeline of recent events:
- New conversations created
- Conversations resolved
- SLA breaches
- Team member status changes
Customization
Date Range
Adjust the time period for metrics:
- Today
- Last 7 days
- Last 30 days
- Custom range
Filters
Focus on specific segments:
- By channel (email, chat, Slack)
- By team member
- By tag
Refresh
Dashboard data refreshes automatically every 30 seconds. Click the refresh icon for immediate update.